Scenario
One of FeatBit's customers reported that some developers are unable to connect to the FeatBit server using the .NET SDK. They used the .NET Console demo to test. This issue wasn't related to the FeatBit server itself, but rather to the network environment on the customer's side.
In any case, it's important to diagnose the issue when running the app. Here's how to debug the connection issue in the .NET Feature Flag SDK (provided by FeatBit, an open-source feature flag provider compatiable with microsoft FeatureManagement-Dotnet).
Materials used in this article
- FeatBit Server SDK .NET Console App Example
- .NET Feature Flag Server SDK
- Feature Flag Server Provider
Steps to debug
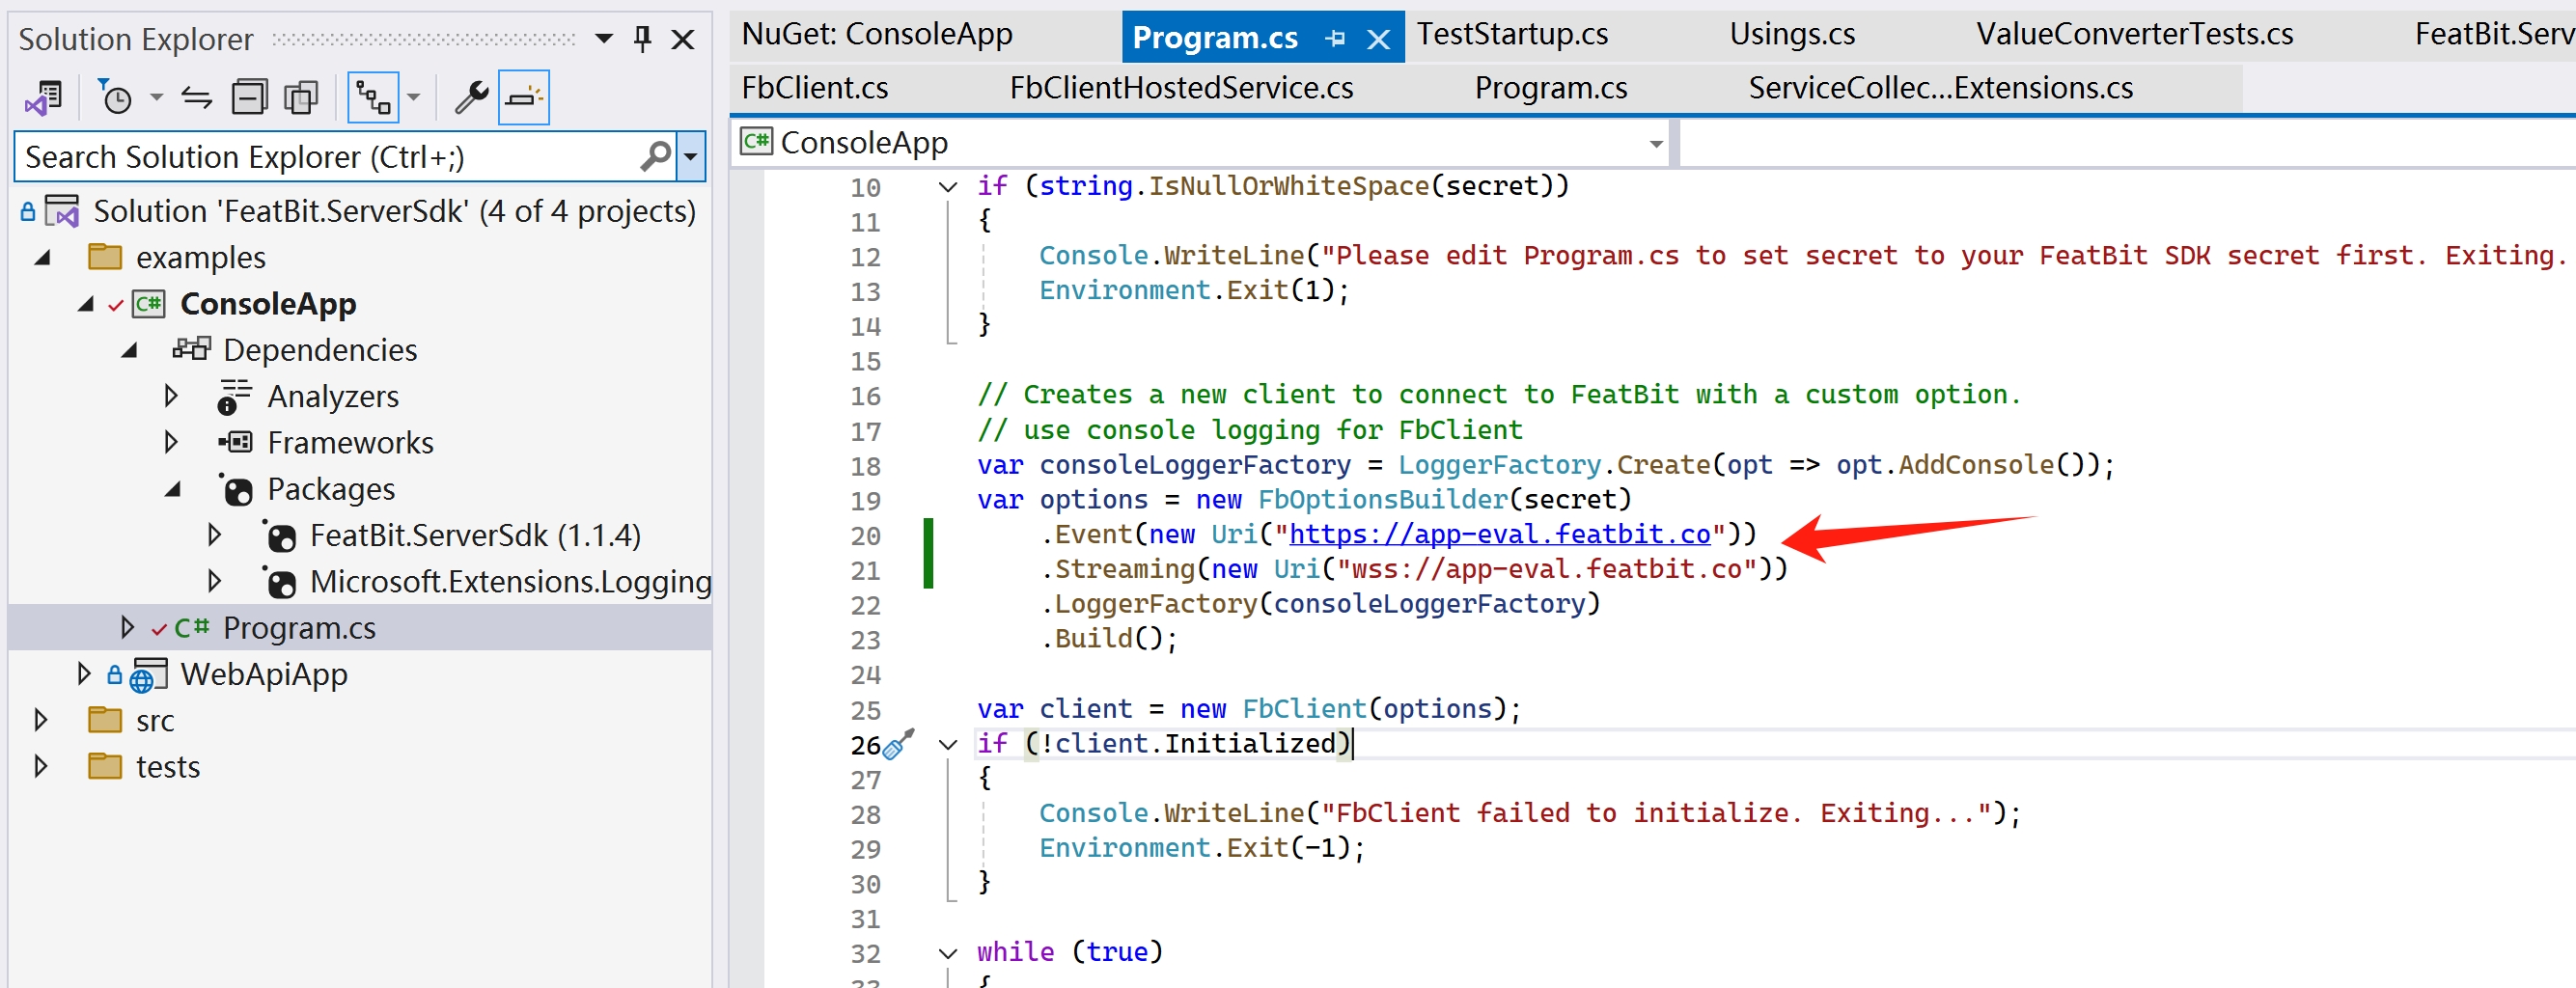
- As shown in the image below, add the FeatBit server URLs to explicitly specify which endpoints the Feature Flag Server SDK should connect to.
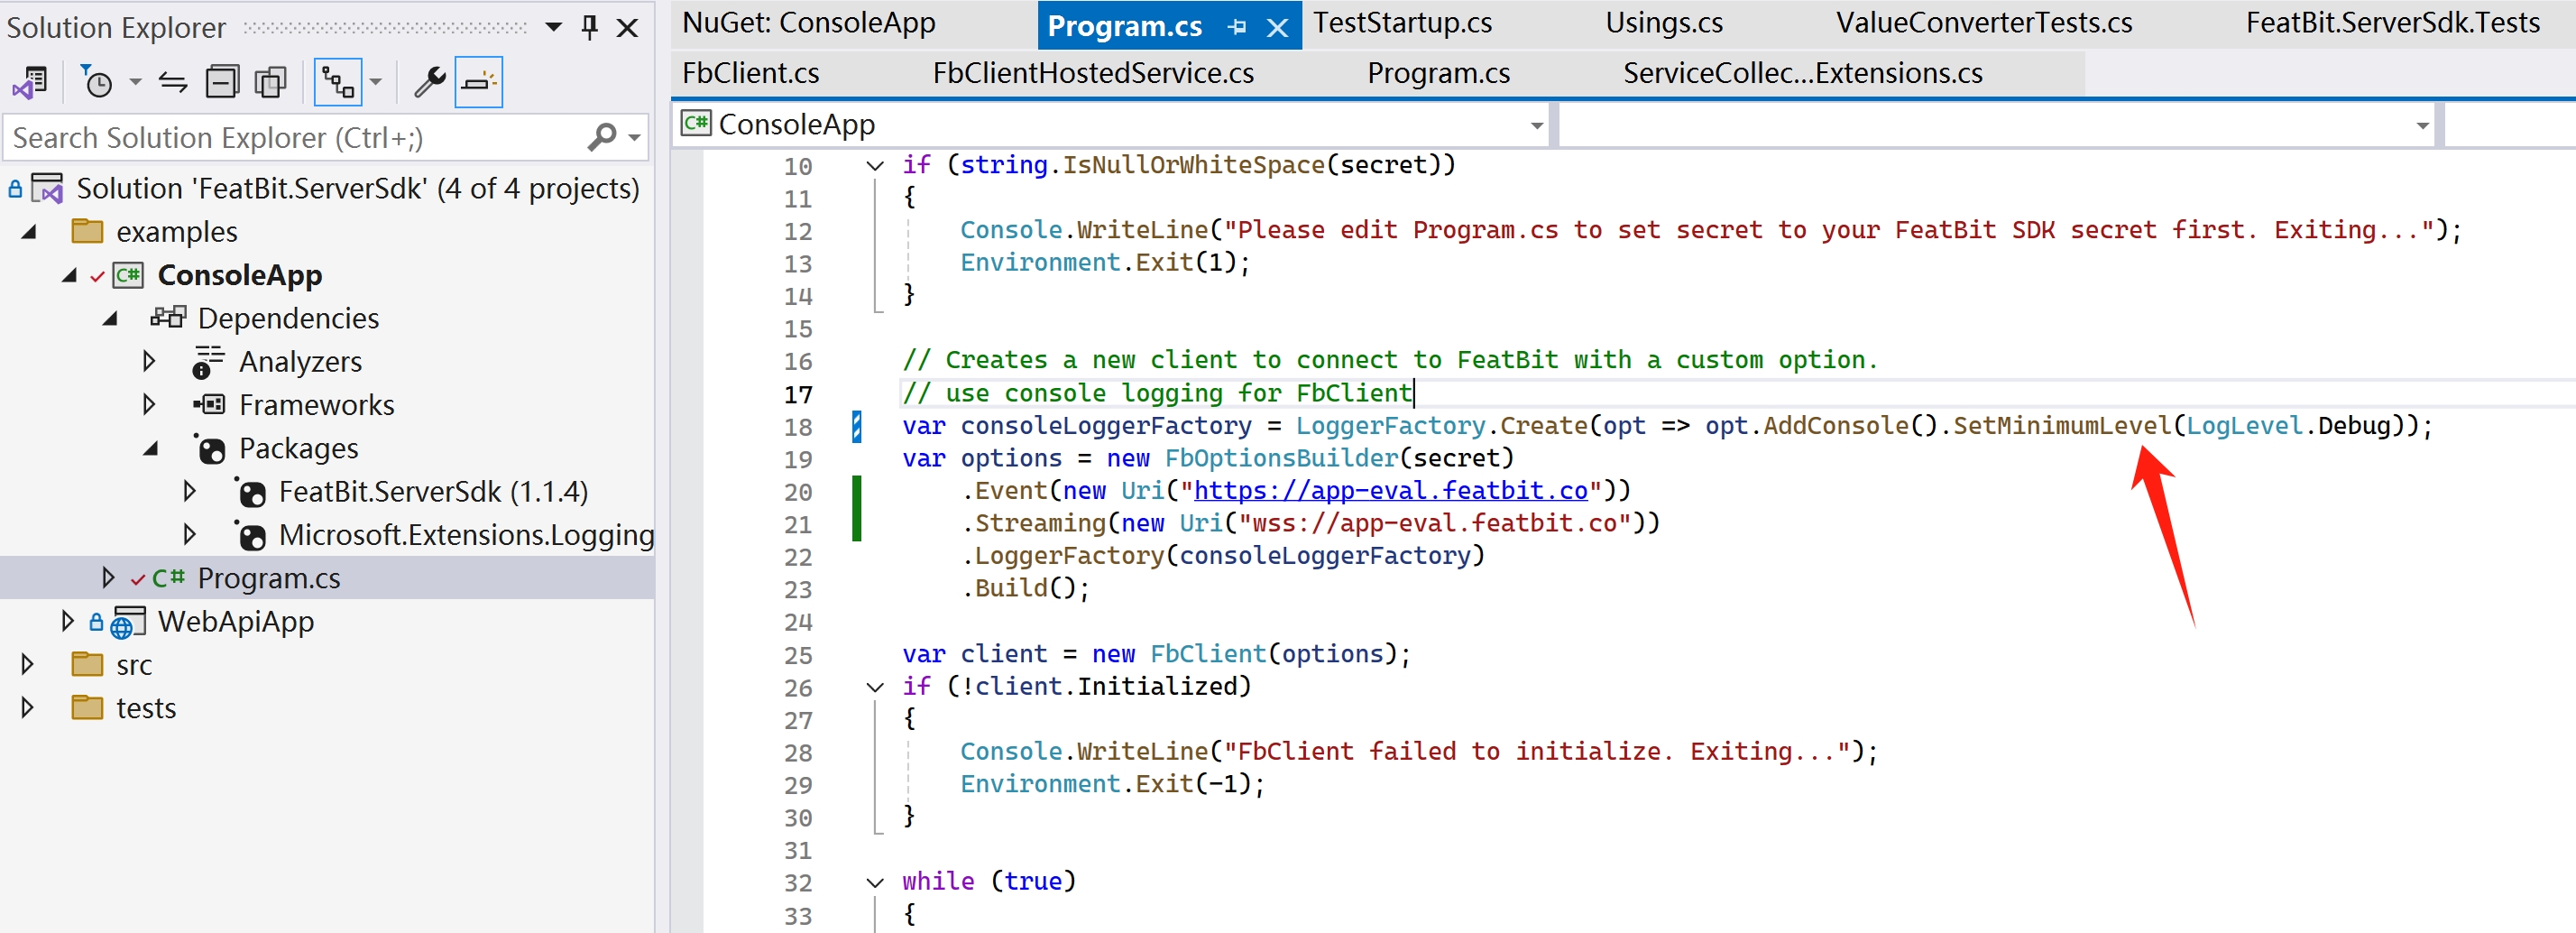
- The key change: in line 18 of
Program.cs, set the minimum log level toDebug.
var consoleLoggerFactory = LoggerFactory.Create(opt => opt.AddConsole().SetMinimumLevel(LogLevel.Debug));
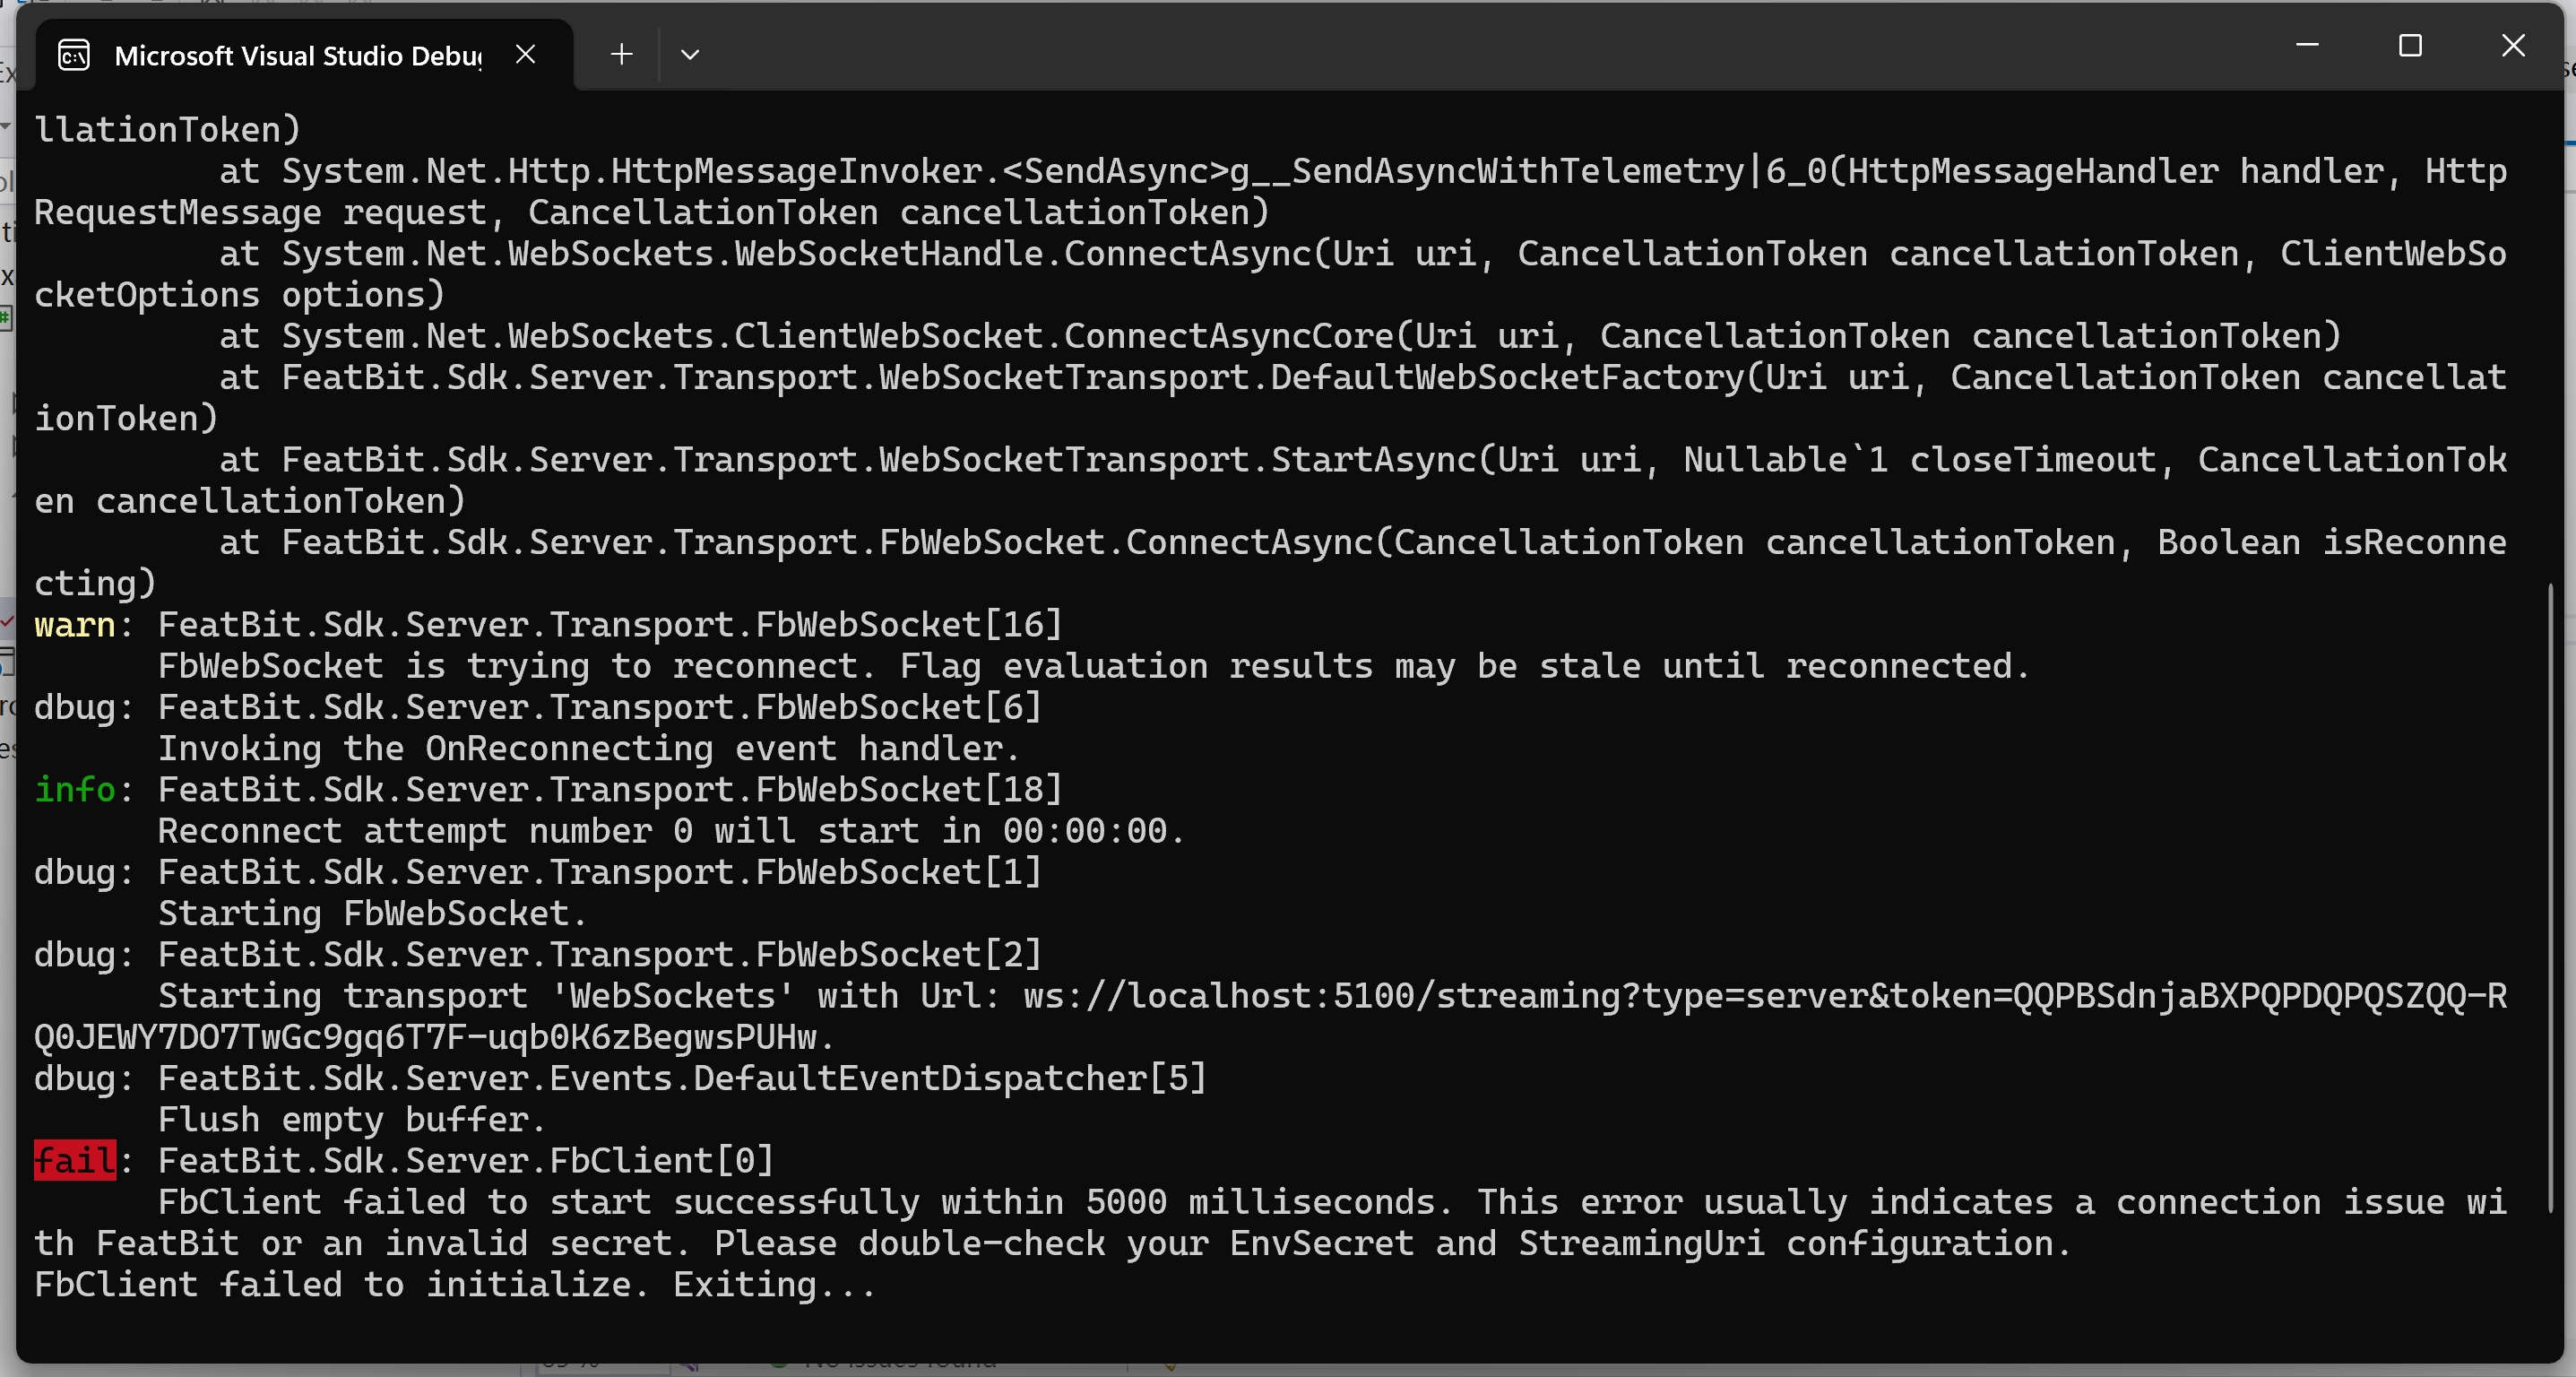
- Run the Console App example. You'll see additional debug logs in the console. Before performing step 1, the debug log shows that the default WebSocket connection URL is
ws://localhost:5100/xxx, which is incorrect.
Result
After following these steps, even if the connection issue is not resolved, you can now see the debug logs and understand the issue better. This will help you diagnose the problem. If you can't find the solution on your own, you can share the debug logs with the FeatBit support team to get help.